The Data Visualizer add-in for Excel is a new arm to Excel which can convert an Excel 365 worksheet into a Visio diagram. This add-in allows the users to automatically create high-quality flowcharts, cross-functional flowcharts, and organizational charts—all the shapes, connections, and data linking—from the data in Excel tables. Users will not need to buy Visio to use the Microsoft Visio Data Visualizer in its simple form, just Excel 365 for Windows/Mac or Online. This is one interesting tool and worth trying if you frequently make flowcharts or diagrams. All you need to get started is an Office 365 subscription—added subscription to Visio is NOT required.
Data Visualizer Add-In for Excel
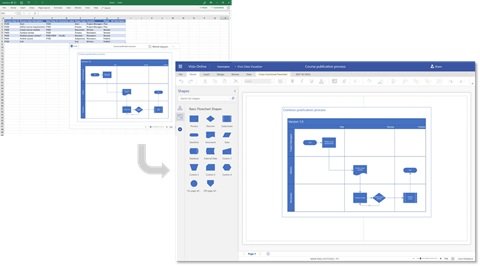
Data Visualizer leverages the best of Excel and Visio; you enter data into an Excel workbook and Visio creates a diagram automatically. Anyone with an Office 365 subscription can use the Data Visualizer add-in to create Visio diagrams; use the underlying Excel data to modify diagrams; and, view, print, and share diagrams. This tool is an alternative to the diagram options already in Office which offers limited options and can be quite annoying.
Create Flowcharts & Organizational charts in Excel
The Data Visualizer add-in for Excel is available for:
Excel on WindowsExcelon Mac andExcel for the web with a work or school account
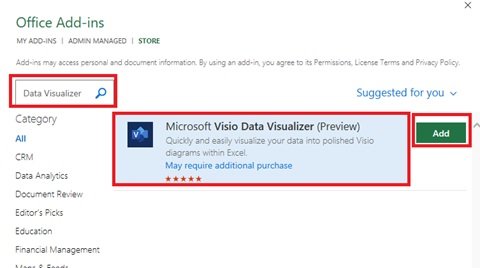
To install Data Visualizer on any of the above, you will have to follow these steps: 1] Open ‘Excel’ and create a new ‘Blank’ workbook 2] Click ‘Insert’ and then hit ‘Get Add-ins’ 3] In the Office Add-ins Store, search for ‘Visio Data Visualizer’ and hit the ‘Add’ button.
4] Now ‘Sign In’ with your account associated with your Office 365 subscription/Microsoft 365 work/ school account. Note: You do not need a Visio subscription to use the add-in. However, if you have an appropriate Visio license, choose ‘Sign In’ otherwise ‘Sign in later’. In this, there will be few functionalities that get unlocked only after you sign in.
Create diagrams/flowcharts from data in Excel
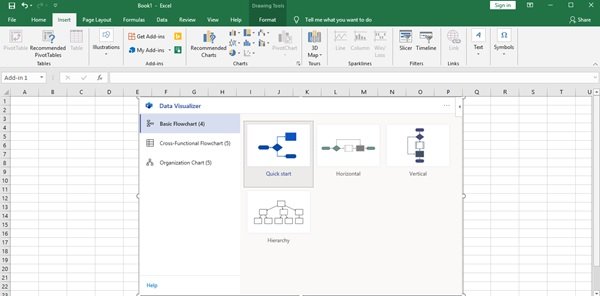
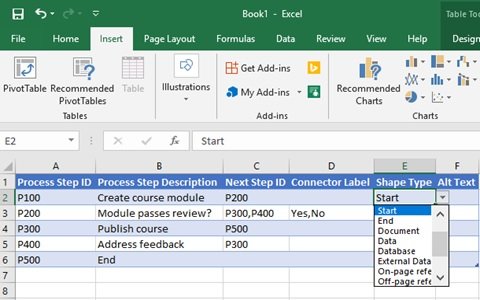
The Data Visualizer add-in for Excel is powered with a variety of editable sample data tables in Excel. Currently, Data Visualizer offers three types of diagram options including Basic Flowchart, Cross-Functional Flowchart, and Organization Chart. These samples are great to help you get started, they allow the users to:
Add process stepsModify connectorsCreate dependenciesInsert ownersAnd much more
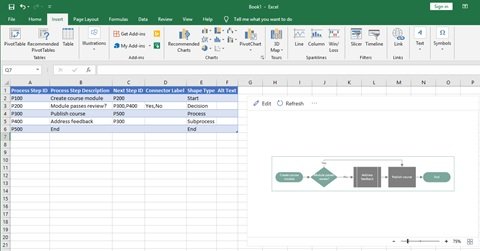
This sample worksheet is just the starting point. You can add more rows, change Shape Types, and switch them around. There are many more choices.
You can even extend this worksheet by adding more columns. These columns do not change the basic Visio diagram but allow you to assimilate the worksheet into the broader analysis. Users can easily replace the sample data with their own and once done – simply hit ‘Refresh Diagram’ to see the changes sync with the data-linked diagram precisely in the Excel sheet.
View, print, and share your diagrams/flowcharts
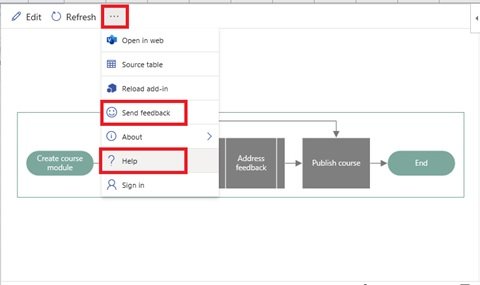
Since your Visio diagrams are created online (saved in OneDrive or SharePoint by default) – viewing, printing, and sharing with other Office 365 users becomes unimaginably simple. Whenever you wish to open your diagram in Visio for the web, select Open in web from the ellipses (•••) in the add-in menu bar.
Note: If you’re not signed in yet, you will be prompted to sign in with your Microsoft 365 or Office 365 work or school account. Select Sign in and then Allow or Accept any permission prompts. After the Visio File is created, select ‘Open File’. From here:
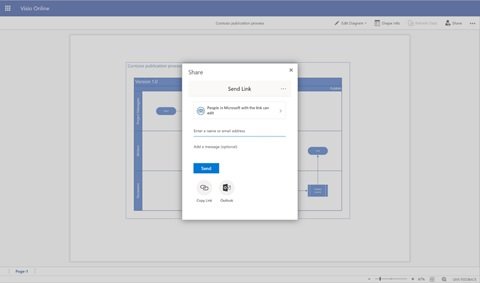
To print – In Visio for the web, select the ellipses (. . .) > Print to print your diagram.To share – Select the ‘Share’ button to create a link or to enter the email addresses of those you want to share with.
Customize & edit diagrams/flowcharts using Data Visualizer add-in
The ‘Edit’ button doesn’t work for those who do not have a separate full Visio license. Without a Visio license, you are stuck with the original color scheme and customizations are restricted. With Visio Online Plan 1 or Visio Online Plan 2 license, users can do a lot with their Data Visualizer diagrams and make their presentations more interesting. They can add text or images, apply design themes, and make other modifications to customize diagrams in Visio or Visio Online. The Bottom line – The only diagram alterations possible are from the source worksheet unless you can access the full Visio version.
Help & Support
Users can get additional support and send their feedback directly to Microsoft from the add-in by clicking the ellipses and clicking ‘Help’ or ‘Send feedback’.
Data Visualizer add-in for Excel is worth trying!
You should try the Visio Data Visualizer Add-In for Excel. Open up a sample worksheet and play around with the flowcharts to see how things work. Source: Microsoft.com.