How to use Reliability Monitor in Windows 10
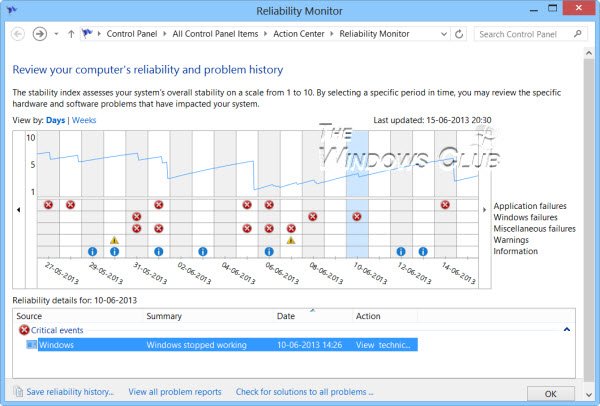
The tool is special in the way that the events which are normally noticeable by users can be picked up by the program and provided in the form of a graphical layout, pinpointing when an issue occurred and for how long it has been occurring. The graph goes down whenever the computer experiences a problem, like software not working or a driver crashing, unexpectedly. Reliability Monitor presents the data in the form of a line chart that provides a system stability overview with detailed information about individual events that may affect the system’s overall stability. By combining what Reliability Monitor logs, and the Events Logs and is detailed in problem reports you are further along in finding out what is causing Windows problems. Reliability Monitor provides a system stability overview and trend analysis with detailed information about individual events that may affect the system’s overall stability, such as software installations, operating system updates, and hardware failures. It begins collecting data at the time of system installation. Under ‘Settings’ search option type reliability to open the Reliability Monitor. Alternatively, you may open the Run box, type the following and hit Enter: Click any event on the graph to view its details. The stability index assesses a system’s stability on a scale from 1 to 10. By selecting a specific period in time, you may review the specific hardware and software problems affecting your system. Via the Control Panel, you can also click Performance Information and Tools and click Advanced Tools in the left-hand green pane; you can open the Reliability Monitor. This new feature gives your computer a reliability score out of 10. This figure goes down whenever your computer experiences a problem, such as a piece of software not working or a driver crash. This helps you identify what causes your computer problems for any particular event. Do also note the System Stability Index that it computes for your machine, in the top RHS corner. It takes into account Software UnInstall Issues, Application Failures, Hardware Failures, Windows Failures & Miscellaneous Failures. By default, the program displays the days of the current month and issues showed up each day. Issues displayed by Reliability Monitor are classified or categorized into following categories: If you want, you can easily switch views from ‘Days’ to ‘Weeks’ by clicking on the link highlighted in Blue. If not, choose the desired day on your Reliability Monitor. This action will provide details pertaining to that issue of the day. You can easily find the underlying cause and correct the problem then. For checking technical details of the problem, click ‘View technical details’ link under the ‘Actions’ column of the corresponding problem. On clicking the link, a ‘Problem Details’ window pops up on your computer screen displaying the date and time of the related problem along with a technical description of it. This information may reveal the error code that might come in handy while looking for a software or app in question. You can then search this site or the Internet for a potential solution.
Generate Reliability Monitor System Health Reports
To generate Reliability Monitor System Health Reports, open Run, type perfmon /report and hit Enter. In a minute or so, a PC health report will be generated which will give you a lot of information. You can read more details here. In case you do not see any reports, make sure that you have enabled Data Collection for Reliability Monitor
Here are shortcuts you can use via Run:
perfmon /rel : Runs Reliability Monitorperfmon /report : Generates System Health Reportpermon /sys : Runs a Standalone Performance Monitor
Read: Enable, Disable Data Collection for Reliability Monitor. If for some reason you find that your Windows Reliability Monitor is not working, you may try to reset it and see if it helps. PS: How to use the Performance Monitor and the Resource Monitor may also interest you.